| McSwiggen & Associates |
| /Applications/Corrosion, Oxidation and Diffusion |

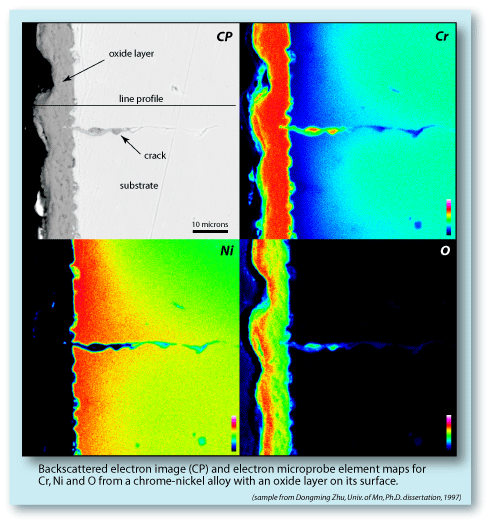
| Corrosion costs the U.S. economy $276 billion / year*, and oxidation is the most significant corrosive process. Understanding the mechanisms and processes by which this oxidation takes place could save billions of dollars. Below is a series of images from a Cr-Ni alloy with a surface oxidation layer. The element maps show that the oxide forming the layer is a pure Cr-oxide (Cr2O3). To produce this oxide layer, the Cr had to diffuse out of the substrate into the surface region, where it could react with the oxygen. The rate of oxide growth is therefore | constrained by the rate of Cr diffusion through the sample. Exceptions occur along cracks, where oxygen can penetrate deep into the sample. In the example below, the element maps show that the crack, which extends at least 40 microns into the substrate, acted as a conduit for the oxygen. A second mechanism that can control the rate of oxidation is the ability of oxygen to diffuse through the existing surface oxide layer and the degree to which it will act as a barrier. (*Federal Highway Administration Report: FHWA-RD-01-156) |
 |
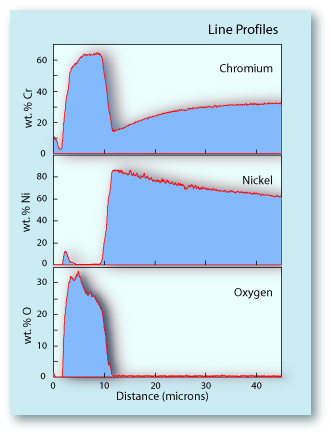
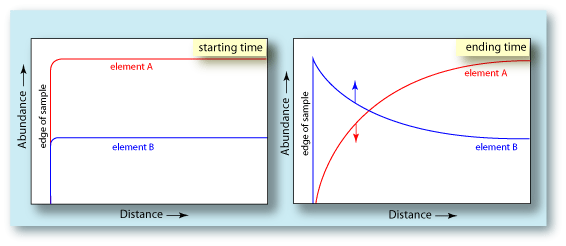
| Diffusion is an important mechanism involved in the formation of the the oxide layer on the surface of this Cr-Ni alloy. The line profiles to the right show the depth to which the diffusion process extended into the substrate. One can see that immediately below the oxide layer, the Cr is significantly depleted relative to Cr-content deeper in the substrate. This is because the Cr was drawn out of the substrate to form the oxide layer. The curvature of the Cr profile is characteristic of a diffusion profile. The diagrams below show an idealized diffusion profile. The first diagram shows the element concentration profiles in a binary alloy before diffusion begins. The concentration of each element is uniform across the sample to the edge. The slight rounding of the profile at the surface edge comes from the analytical procedure of using an electron beam of some finite diameter. The second diagram shows the concentration profiles after a period of time when element A has diffused from the sample. Its concentration decreases with decreasing distance from the surface. Element B reacts in an opposite fashion. Since element A has been drawn out of the sample, leaving element B behind, its concentration would increase with decreasing distance from the surface. This relationship is exactly what is seen in the Cr-Ni alloy. The abundance of Cr lessens towards the surface, while the abundance of Ni is increasing towards the surface. |  |
 |


